
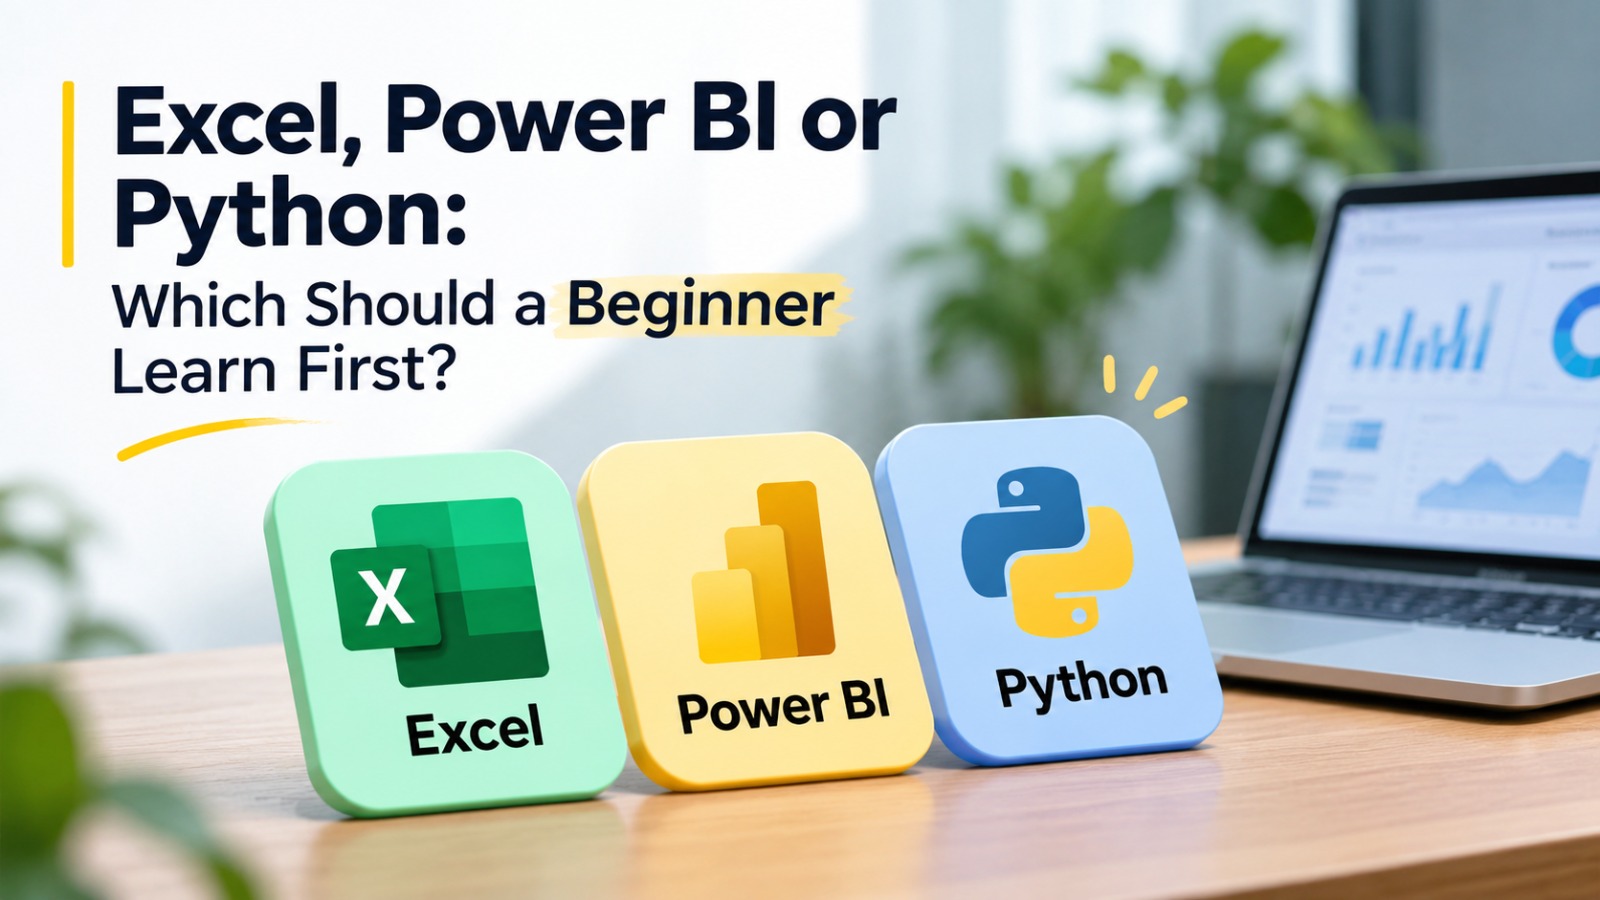
Excel, Power BI or Python: Which Should a Beginner Learn First?
Starting a career in data analytics can feel confusing. You may see Excel, Power BI and Python in almost every learning roadmap. But which one should you learn first?
The answer depends on your career goal. Each tool solves a different problem. You do not need to master everything on your first day.
This guide explains Excel vs Power BI vs Python, their differences and the right learning order for beginners.
What should you learn first?
Start with Excel to understand how data works, move to Power BI to build dashboards and explain results, then learn Python for larger datasets, automation and machine learning. If you want an analyst role, prioritise Excel and Power BI. If you aim for data science or AI, introduce Python earlier.
Key takeaways
Excel helps you organise, calculate and analyse data.
Power BI turns data into interactive dashboards.
Python helps automate tasks and handle advanced analysis.
SQL is another important skill for working with databases.
In this guide:
What each tool does
Which tool suits your career goal
Why Excel still matters
Power BI vs Python
Where SQL fits
A practical 90-day learning plan
Beginner portfolio projects
What is each tool actually used for?
Excel, Power BI and Python are three different tools. They can work together on a single data analytics project. Understanding their individual purposes makes your learning journey easier.
1. Microsoft Excel
Excel is a spreadsheet application used to store, organise, calculate and analyse information.
You can enter data into rows and columns. You can use formulas to calculate totals, averages and percentages. Features such as sorting, filtering, charts and Pivot Tables help you understand information.
Example: A sales executive receives monthly sales records. They can use Excel to calculate total sales, compare products and identify the best-performing month.
2. Microsoft Power BI
Power BI is a business intelligence and data visualisation tool. It helps you convert information into interactive reports and dashboards.
You can connect Excel files, databases and other sources. Power Query helps clean and transform information. DAX helps create calculations and measures.
Example: A sales manager wants to view monthly revenue, regional performance and product sales. Power BI can display these details in one interactive dashboard.
3. Python
Python is a programming language used for data analysis, automation, software development and machine learning.
For data analytics, libraries such as Pandas and NumPy help process information. Matplotlib and Seaborn help create charts. Python also supports advanced data science and AI applications.
Example: A company receives thousands of sales records every month. Python can clean the records, calculate important values and repeat the analysis automatically.
Excel vs Power BI vs Python: Comparison table
| Comparison | Excel | Power BI | Python |
| Main purpose | Spreadsheet analysis | Dashboards and reporting | Programming and data analysis |
| Beginner difficulty | Easy | Easy to moderate | Moderate |
| Main skills | Formulas, charts, Pivot Tables | Power Query, DAX, visuals | Syntax, Pandas, NumPy |
| Best for | Daily calculations | Business reporting | Automation and advanced analysis |
| Data handling | Small and medium datasets | Connected and modelled datasets | Large and complex datasets |
| Typical roles | Reporting Executive, MIS Executive | Power BI Developer, BI Analyst | Python Developer, Data Analyst |
| Main limitation | Manual work can increase | Requires data modelling knowledge | Requires programming practice |
No single tool replaces the others. The right choice depends on the problem you want to solve.
Which should you learn first based on your career goal?
Your career goal should guide your learning order. A future data analyst does not need the same starting point as an aspiring machine learning engineer.
Use this table to choose your path.
| Career goal | Recommended learning order |
| Data Analyst | Excel → SQL → Power BI → Python |
| Business Analyst | Excel → SQL → Power BI |
| Data Scientist | Python → SQL → Statistics → Machine Learning |
| AI/ML Engineer | Python → Mathematics → Machine Learning → Deep Learning |
| Marketing Analyst | Excel → Power BI → SQL → Python |
| Finance Analyst | Excel → SQL → Power BI → Python |
| MIS Executive | Advanced Excel → Power BI → SQL |
| Python Developer | Python → SQL → Django or other frameworks |
For most beginners targeting data analyst roles, Excel is the best starting point. It builds your understanding of rows, columns, formulas and data relationships.
Power BI is the next step. It teaches you how to present information and communicate business insights.
Python becomes valuable when your work requires automation, advanced analysis or machine learning.
When can you skip Excel?
You can start with Python if you already have programming experience and want a software development, data science or AI career. However, understanding spreadsheet concepts remains useful when working with business data.
Is Excel still worth learning in 2026?
Yes. Excel remains a useful skill across many business departments.
Finance teams use it for budgeting and calculations. HR teams use it for employee records. Sales teams use it to track targets. Operations teams use it for daily reports.
Learning Excel also develops basic analytical thinking. You understand how information is structured before moving into advanced tools.
Start with these topics:
Basic formulas such as SUM, AVERAGE and COUNT.
Logical functions such as IF and IFERROR.
Lookup functions such as XLOOKUP and VLOOKUP.
Sorting, filtering and data validation.
Conditional formatting.
PivotTables and PivotCharts.
Basic data cleaning.
However, Excel has limitations. Repeating large manual tasks can become time-consuming. Complex reports may also become difficult to maintain.
That is where Power BI and Python become useful. You can move from spreadsheet-based work towards automated analysis and interactive reporting.
Is Power BI easier than Python?
For many beginners, Power BI feels easier at first. It offers a visual interface where you can connect data, select charts and create reports.
Python requires a different approach. You must understand programming concepts, write code and identify errors. It takes practice before you can independently build useful analysis programs.
However, Power BI is not limited to dragging and dropping charts. You must learn data relationships, Power Query and DAX to build reliable reports.
Here is a simple comparison:
Power BI learning involves:
Connecting data sources.
Cleaning data using Power Query.
Creating relationships between tables.
Writing DAX measures.
Designing interactive dashboards.
Python learning involves:
Variables and data types.
Conditions and loops.
Functions and modules.
Data structures.
Pandas and NumPy.
Data visualisation and automation.
If you already know Excel, Power BI is a natural next step. If you enjoy programming and problem-solving, Python may be more interesting.
Do not choose a tool only because it looks easy. Choose it based on the work you want to perform.
When do you actually need Python?
Python becomes important when basic spreadsheet analysis is not enough.
Consider a company that receives customer records from multiple branches. Every month, the team must combine files, remove duplicates, calculate totals and prepare reports.
Doing everything manually can take considerable time. Python can automate many of these repeated steps.
Python is particularly useful for:
1. Handling larger datasets
Libraries such as Pandas help read, clean, filter and analyse structured data.
2. Automating repeated tasks
Python scripts can perform recurring calculations, combine files and generate reports.
3. Statistical analysis
Python supports statistical calculations and data exploration.
4. Machine learning
Libraries and frameworks such as Scikit-learn help build predictive models.
5. Artificial intelligence
Python is widely used in AI applications, machine learning workflows and data processing.
If you want to become a Python developer, you can also explore backend development using Django or other frameworks.
For learners looking beyond basic analytics, explore the Python training programme at Camerin.
Remember: You do not need advanced Python before building your first dashboard. Learn it when your career goal or project requires it.
Where does SQL fit into data analytics?
SQL stands for Structured Query Language. It is used to communicate with relational databases.
Think about a company that stores customer details, orders and payments in separate database tables. You cannot always depend on downloading everything into Excel.
SQL helps you retrieve the information you need.
For example:
SELECT product_name, SUM(sales_amount) AS total_sales
FROM sales
GROUP BY product_name
ORDER BY total_sales DESC;
This query groups sales by product and displays products with higher sales first.
Important SQL topics for beginners include:
SELECT and FROM.
WHERE and ORDER BY.
GROUP BY and HAVING.
JOIN operations.
Aggregate functions.
Subqueries.
SQL works alongside all three tools. Excel can analyse exported database records. Power BI can connect to databases. Python can retrieve and process database information.
For data analyst roles, learning SQL is an important part of your preparation. Do not treat it as an optional replacement for Excel, Power BI or Python.
What does a practical 90-day learning plan look like?
A 90-day plan gives you a structured starting point. The following schedule assumes consistent practice alongside your regular studies or work.
Days 1–30: Build your Excel foundation
Week 1: Understand spreadsheets, rows, columns, formatting and basic calculations.
Week 2: Practise formulas, IF conditions, lookup functions and data validation.
Week 3: Learn sorting, filtering, data cleaning and conditional formatting.
Week 4: Create PivotTables, charts and a monthly sales report.
Your target: Complete one Excel-based sales analysis project.
Days 31–60: Learn Power BI
Week 5: Understand the Power BI interface and import Excel data.
Week 6: Learn Power Query, data cleaning and transformation.
Week 7: Understand relationships, data modelling and basic DAX.
Week 8: Create interactive dashboards using charts, cards, filters and slicers.
Your target: Build a sales dashboard with monthly and regional performance.
Days 61–90: Start Python and SQL
Week 9: Learn Python variables, data types, conditions, loops and functions.
Week 10: Understand lists, dictionaries and basic Pandas operations.
Week 11: Practise NumPy, data cleaning and basic visualisation. Start SQL queries using SELECT, WHERE and GROUP BY.
Week 12: Complete a small analysis project using Python and SQL.
Your target: Automate a simple data-cleaning task and document your findings.
At the end of 90 days, you should have practical experience with all three tools and a starting portfolio.
You may need more time to become confident. Your progress depends on practice, previous knowledge and learning consistency.
What projects can prove your skills?
Watching tutorials is not enough. Employers and interviewers need to understand how you apply your knowledge.
Build small projects using realistic business problems.
Excel project: Monthly sales analysis
Create a spreadsheet containing product names, sales dates, quantities and revenue. Use formulas and PivotTables to identify the best-selling products.
Power BI project: Interactive business dashboard
Use the same sales dataset. Build a dashboard showing revenue trends, product performance and regional comparisons.
Python project: Sales data automation
Import the same dataset using Pandas. Remove duplicates, handle missing values, calculate monthly totals and generate a summary report.
Keep your project files, explanations and screenshots together. Explain the problem, your approach and the result.
Also explore our upcoming portfolio resource: [How to Build a Portfolio That Gets You Shortlisted in Kochi
Can you learn these tools together through a structured course?
Yes. A structured learning programme can help you understand how the tools connect.
For example, learning Excel first gives you a foundation. Power BI helps you present the same information. Python allows you to automate and extend your analysis.
Camerin's Data Analytics course in Kochi is listed in the team's brief as a five-month programme covering Excel, Power BI and Python.
Course details to verify before publishing:
Duration: 5 months.
Choose a course based on its actual syllabus, practical exercises, trainer support and project work. Ask for the current curriculum before enrolling.
What is the real learning experience at Camerin?
A real student project can help readers understand how these skills are applied.
The Camerin team should provide one student dashboard or analysis with written permission. The example should include the student's learning objective, tools used, project explanation and a verified outcome if the student has shared one.
A trainer interview should also confirm the recommended beginner learning order, common learning mistakes and suggested first projects.
No student outcome or trainer quotation should be published without confirmation.
Conclusion: Which tool should you start learning today?
If you are completely new to data analytics, start with Excel. Once you understand how data works, move to Power BI and learn how to create meaningful dashboards. Then introduce Python for automation and advanced analysis.
Remember to include SQL in your learning journey. It helps you work with information stored in databases.
Your first goal should not be mastering every tool. It should be completing practical projects and understanding how each tool solves a business problem.
Interested in building these skills through a structured programme? Explore the Camerin Data Analytics course or contact the team at +91 97444 54547 to discuss the curriculum.




 How can I help you?